Context about PREP:

The average population don’t know how to use election data.

The most common problems:

  • People don’t know how the country is divided into districts.
  • People do not know how to see the results of their locality.
  • People don’t know how total voting and representative voting works.
Software to use:

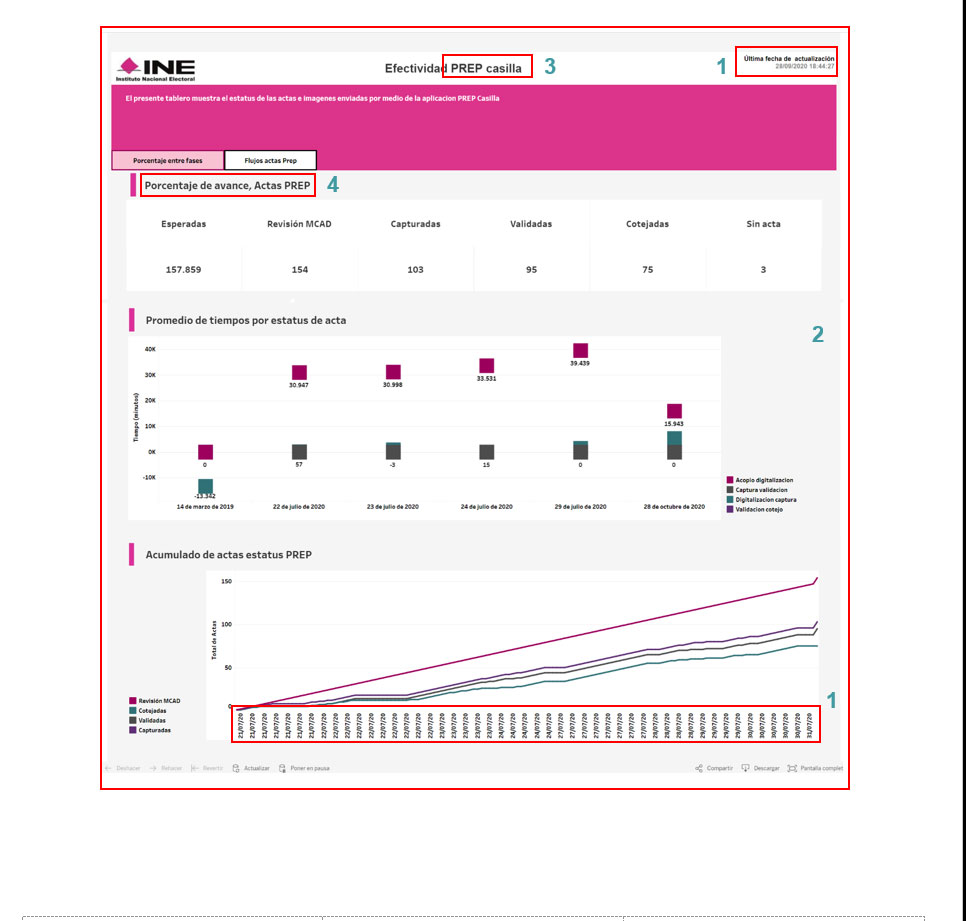
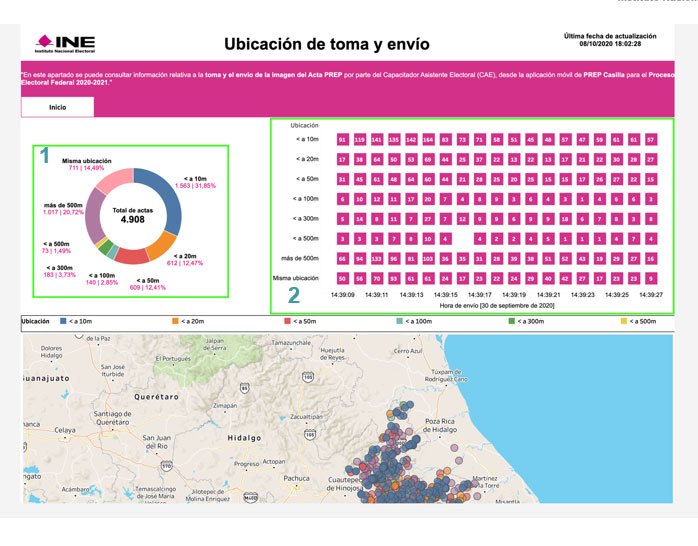
Older PREP system (click on image to enhance.

Design Thinking

1 Empathize

Emphaty maps

For this phase, 5 people were interviewed for each profile, among these profiles are: university researcher, professional researcher, political affiliate, communication and media, and the common citizen.

User personas

2 Define

Value proposal

The proposal offered is: the new digital electoral vote pre-counting system must has an easy navigation, the users can recognize the hierarchy at they are located on the system, can compare data easily and it will be friendly to people with a low electoral culture.

User stories

Vote hierarchy

Priority – high

Estimation – high

As a electoral institute I must to show transparently the voting type, so that people can view the district and political actors.

Acceptance criteria

  • I must have a hierarchy where the territorial level of voting is shown.
  • In the hierarchy, the difference between districts and political actors has to be shown at the level at which it is found.
  • Citizen participation, court and captured minutes must be quantified.
  • Total minutes, nominal list and citizen participation by hierarchy must be show

Reduced comparison bias

Priority – medium

Estimation – medium

As a political party worker I want to compare political actors and political parties so that I can have a small bias of  these data.

Acceptance criteria

  • The user need to recognize the political actors and parties depending on the election.
  • The user need to acknowledge total votes and total percentage.
  • The user need to recognize total votes and percentage by hierarchy.

Direct results from polling booth

Priority – medium

Estimation – low

As a voter I want to search my polling booth, so that I can know the results of my town

Acceptance criteria

  • The user must have his/her voter ID card on hand.
  • The user must recognize the state where his/her voter ID card is registered.
  • The user must recognize the section where his/her voter ID card is registered.
  • The user must recognize his/her first name is registered on his/her voter ID card.

3 Ideate

To begin this part of publishing results, a benchmark was carried out of several countries in the world that have a similar system of elections in Mexico of Pre-count, the surprise was that we are one of the few countries that have this type of electoral processes.

Drafts

Wireframe

Low-res

Mockups

The solution

Users can have a better navigation to see how the voting statistics are doing.

The emerging products of the prototyping and mock-up process are clean results, with information hierarchy, geopolitical hierarchy, and comparison of results between different political actors.

Button switch

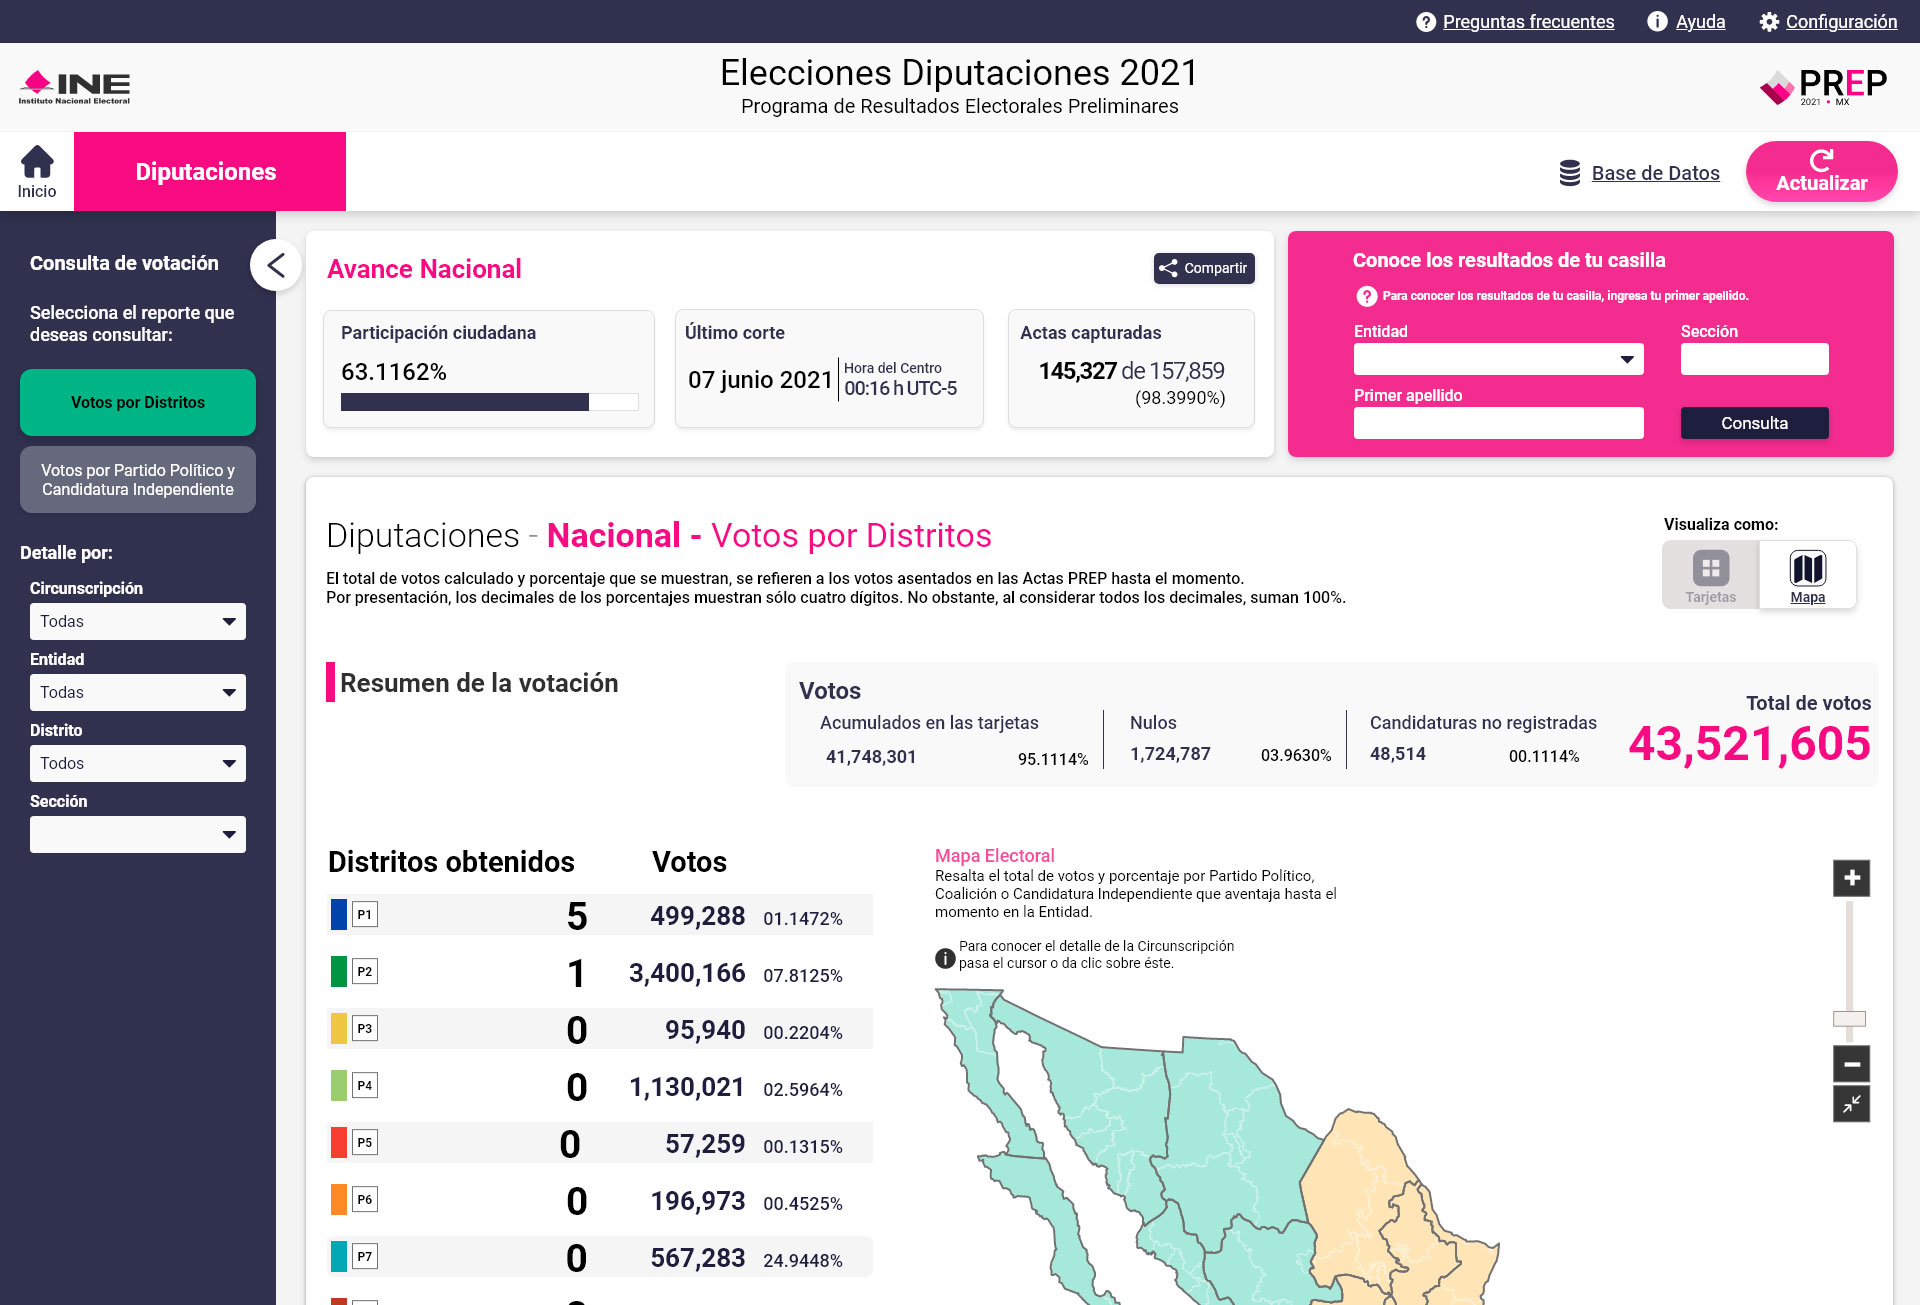
Type of votes by political party and districts won by party.

Combos navigation

The most appropriate navigation is from largest to smallest (country – constituency – state – district – section – box)..

side navigation

Control Panel.

Voting statistics
Find your section

Find it with your voter ID in the data section.

Changue statistics

Vote Chart Type

Voting data

4 Prototype

5 Testing

People could differentiate the national or regional vote data.

Users who finished the test

75%

People can search their voting section whits their INE Card.

Users who finished the test

42%

People can view distrital votes, and votes per political party.

Users who finished the test

81%

People can compare vote detail.

Users who finished the test

43%